
Profiling speed, memory & SQL : what tools ? Part 1
There are many tools available for profiling Python code, each with its own strengths and weaknesses. Let’s take a look at which tool is best suited to which use case.

We’ll be running profiling on the same code with different tools so you can see the output generated. At the end of this article we’ll make a comparison of the tools. And when to use which one.
The tools
PyInstrument: Statistical profiler, great for getting a high-level overview of what your code is doing.
cProfile: Deterministic profiler, useful for getting a detailed breakdown of every function call.
Py-Spy: Sampling profiler that can attach to running processes, great for production debugging.
Scalene: A powerful profiler that tracks CPU time, wall time, and memory.
time(Linux shell): Simple but effective for measuring total runtime, including imports, I/O, and startup overhead.
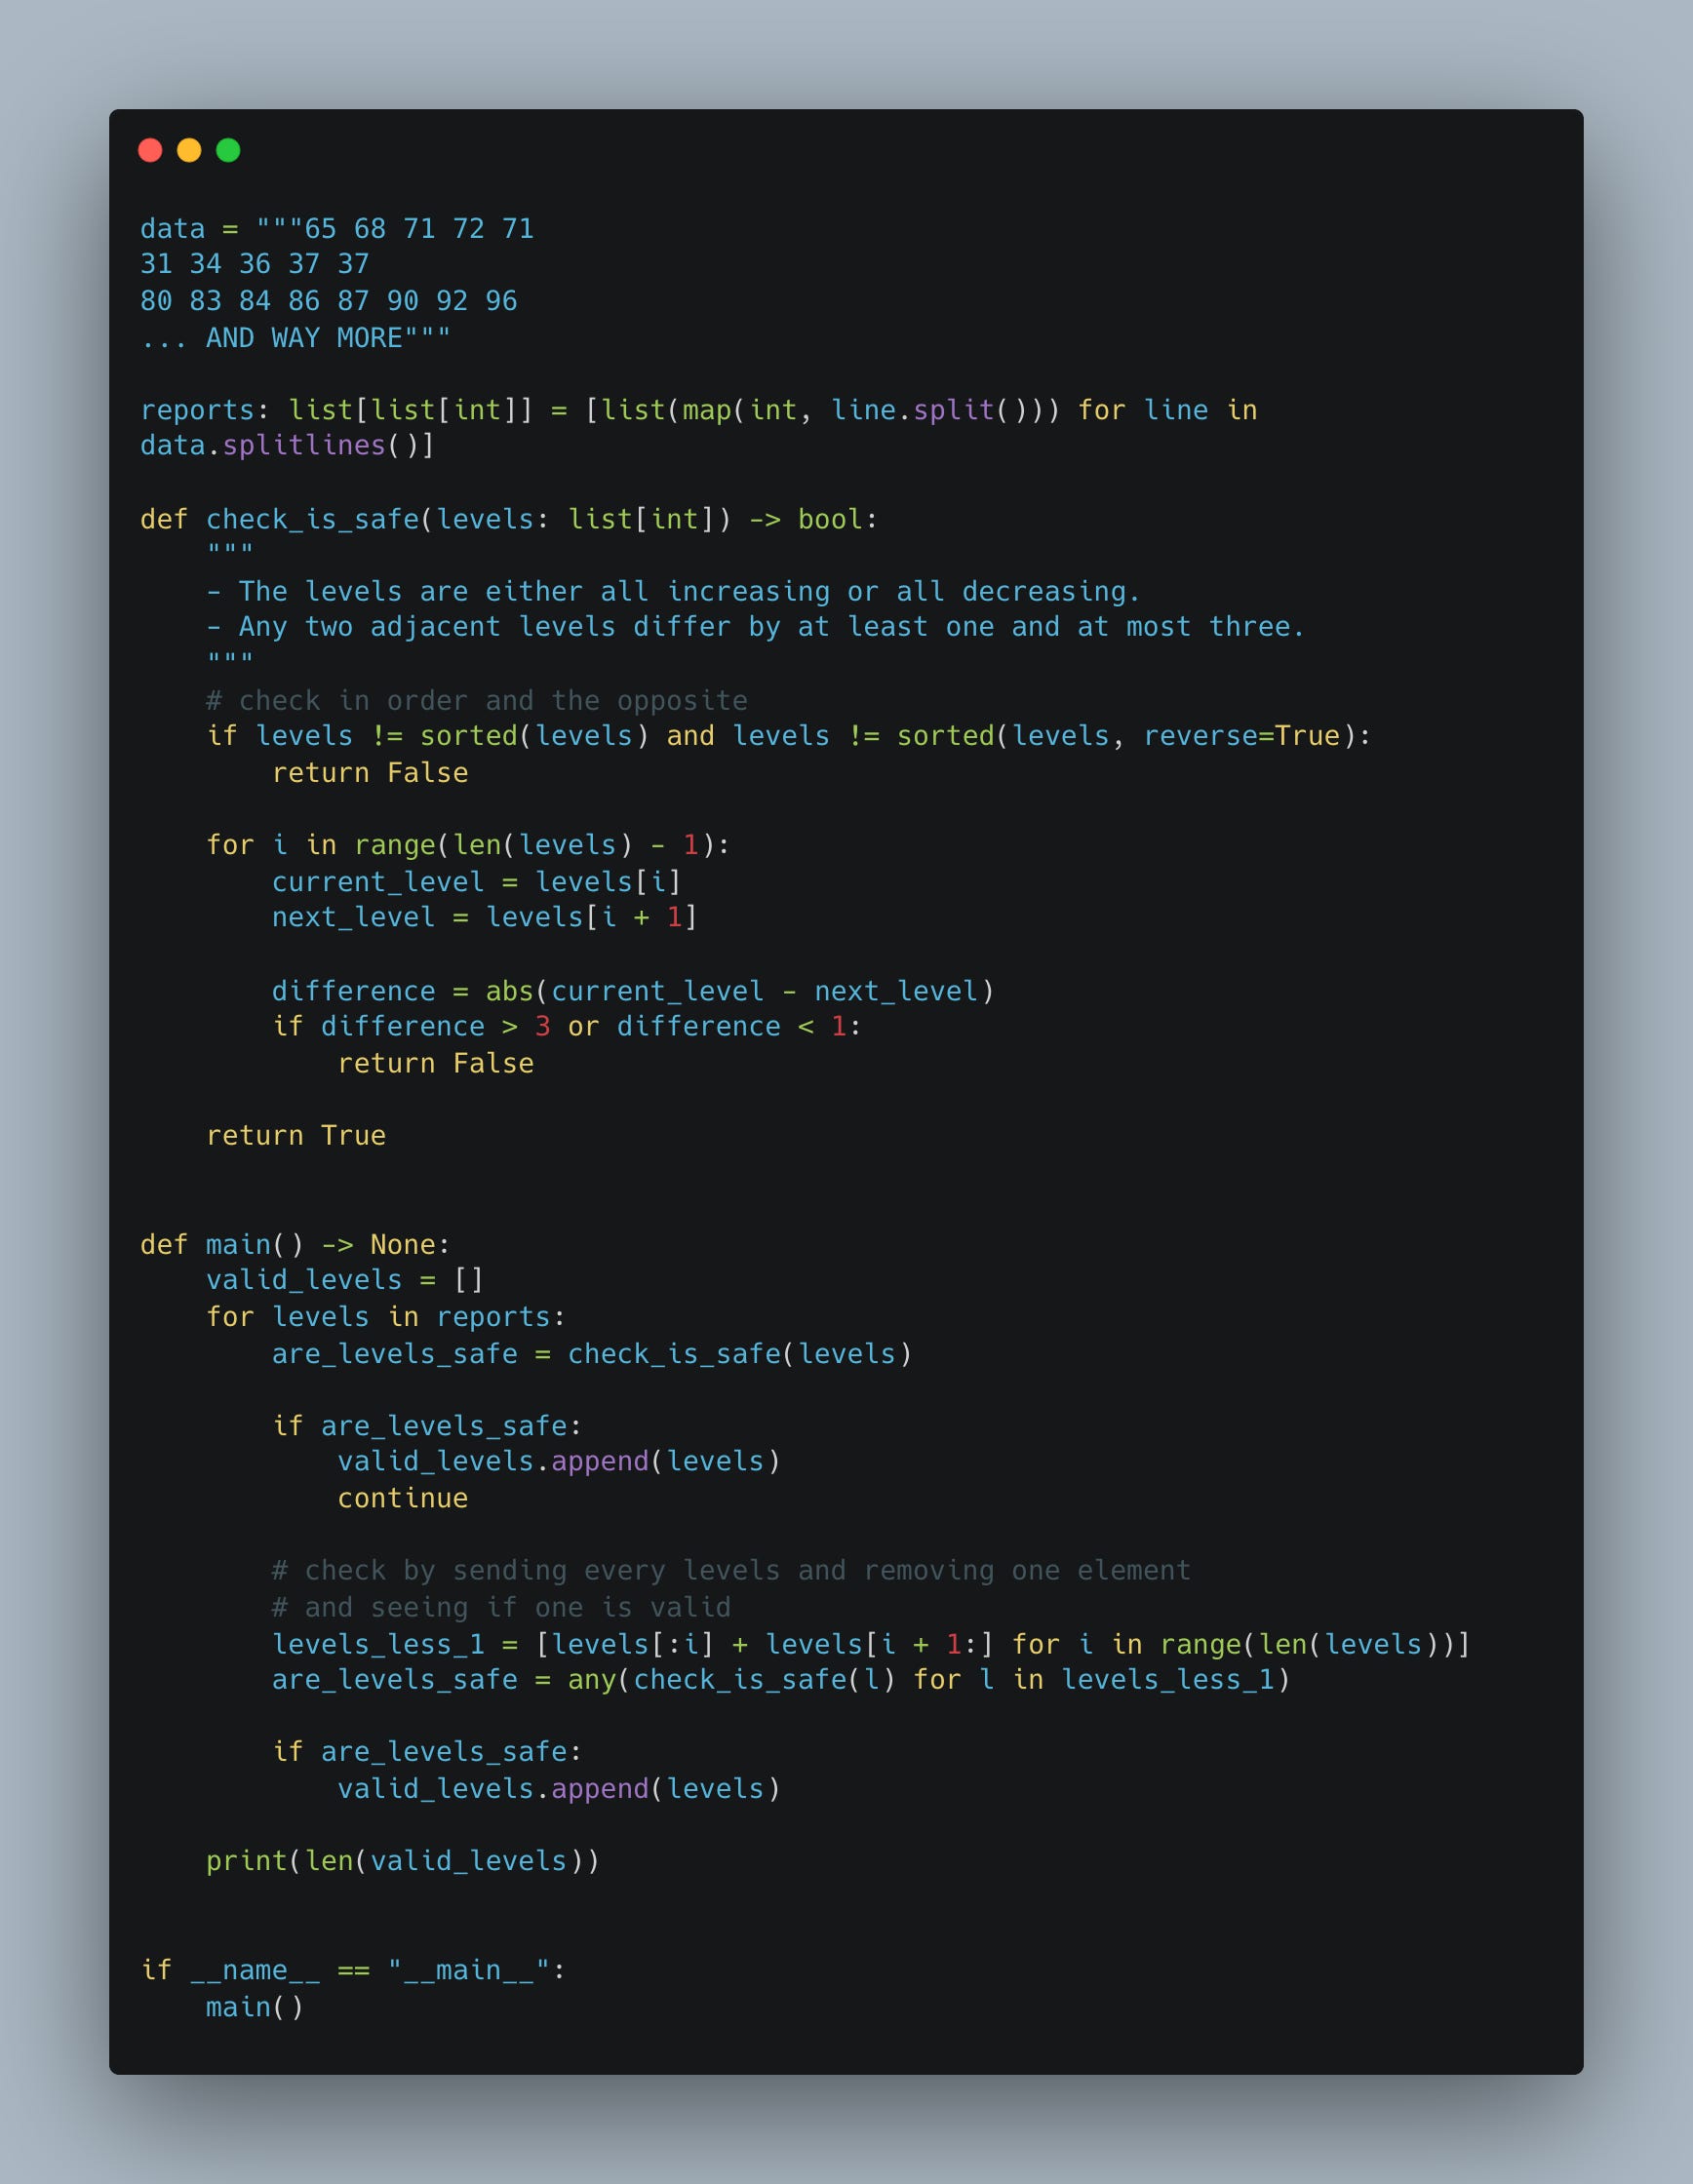
The code we’ll profile
Day 2 of Advent of Code 2024 (yeah, shame on me, I only did Day 1 last year, so I did the second day for this example…)
I’ve implemented a solution to the second part of the challenge (usually the trickier one).
To better highlight potential optimizations (and make profiling results more meaningful), I’ve deliberately increased the input size, so we can observe where time or memory is being consumed.
Here’s what I came up with, it could be improved (that’s the point) but it works.
time
time python aoc2-2.py

The classic time command gives us a quick look at how long the entire script took to execute. In this example, the total runtime is reported as 2.850 seconds, with almost all of it spent in user space (2.81s user) and very little in system calls. This tool is extremely simple but useful to establish a performance baseline. However, it gives us no insight into what inside the program took time, just that it took time.
PyInstrument:
pyinstrument -r html aoc2-2.py
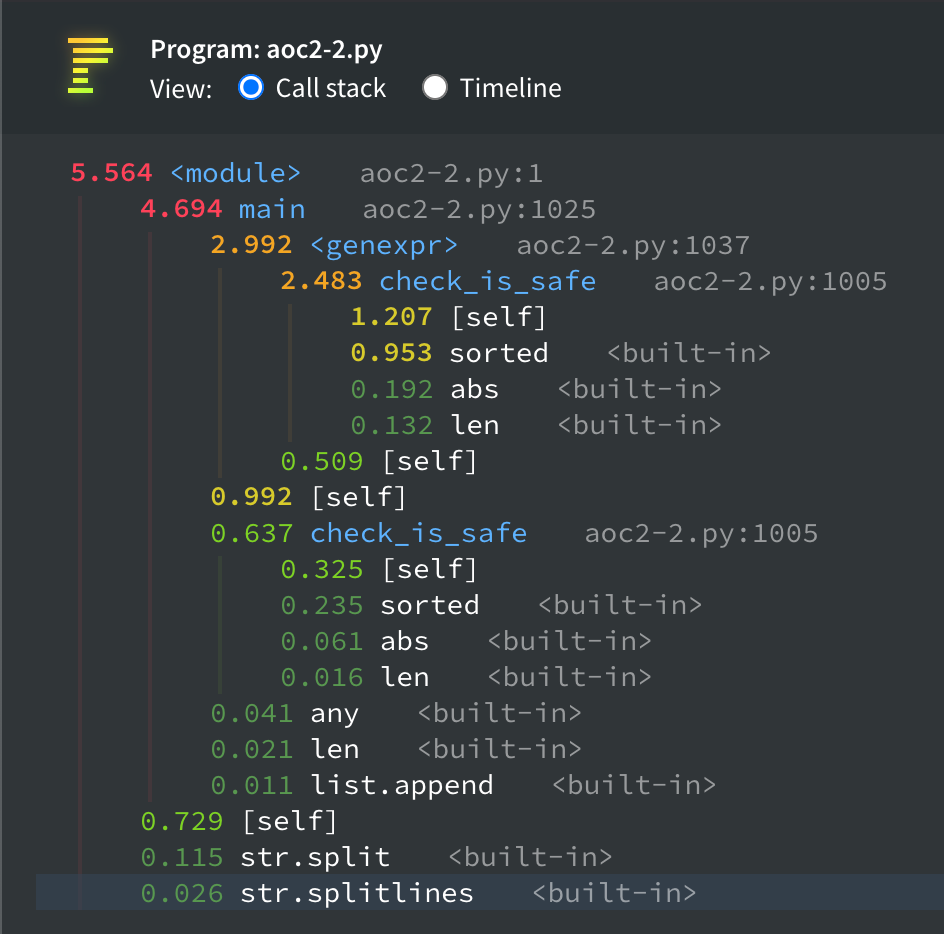
PyInstrument offers a view of where your code spent its time, using stack sampling. In the screenshot, we can see that most of the time is spent inside the main function, and more precisely inside a generator expression and the check_is_safe function. PyInstrument makes it easy to spot where time accumulates.
Also, the interface is clear and beautiful.
cProfile
python -m cProfile aoc2-2.py -s cumtime
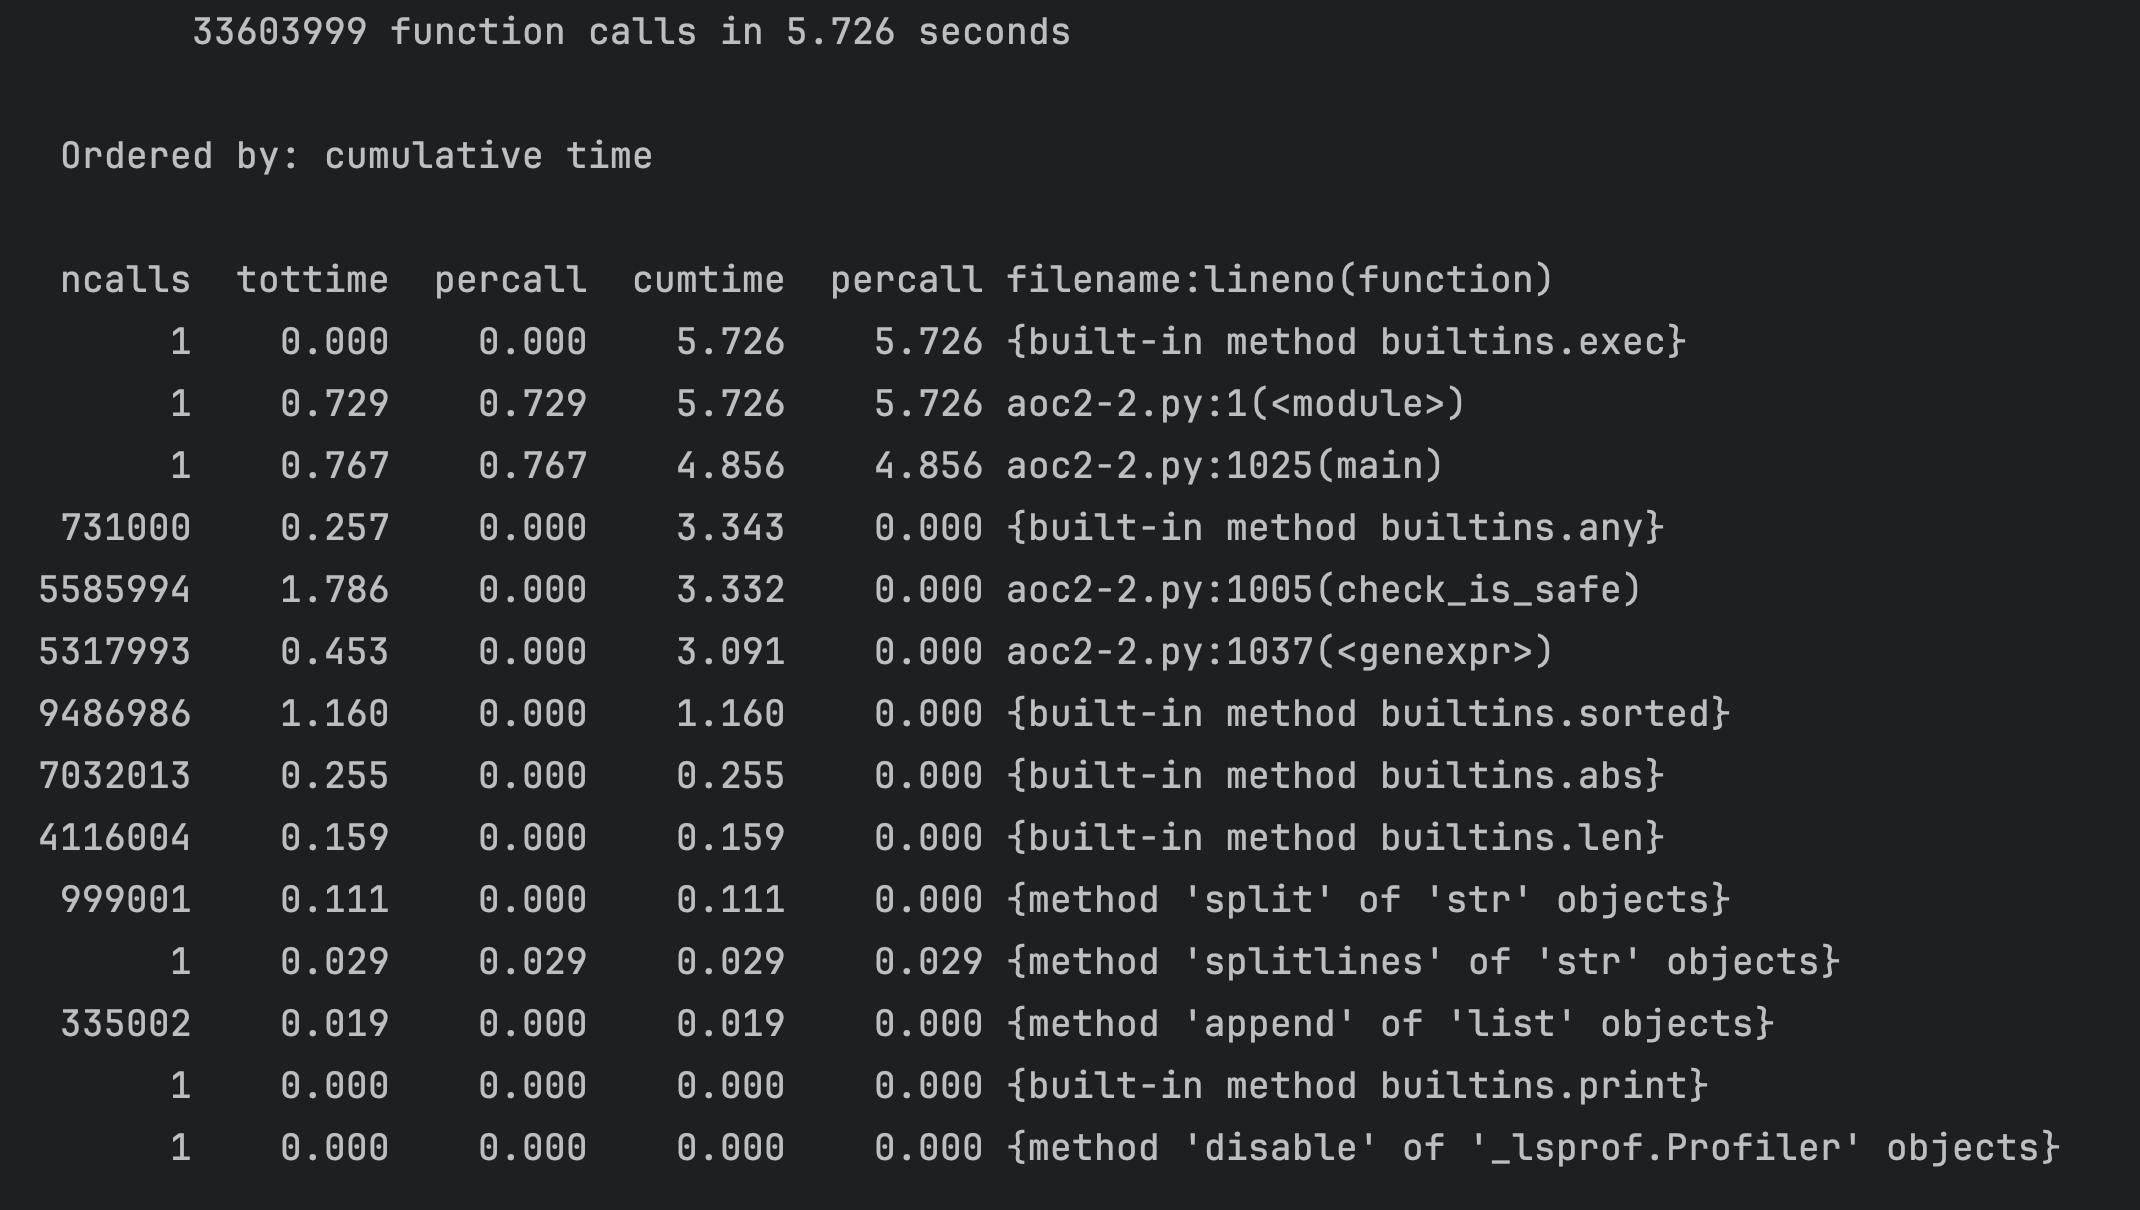
With cProfile, we get a detailed view of function calls, how many times each was called, the total time spent, and how it contributes to cumulative runtime. In this case, check_is_safe was called over 5 million times, and sorted and abs were also heavily used. This profiler is very precise.
Still, it’s great for seeing exact function-level cost and how often they’re triggered.
I personally like to start with PyInstrument to get a rough idea and then use cProfile. Since it’s a deterministic profiler, the overhead is superior to tools like PyInstrument.
py-spy
sudo py-spy record -o profile.svg -- python aoc2-2.py
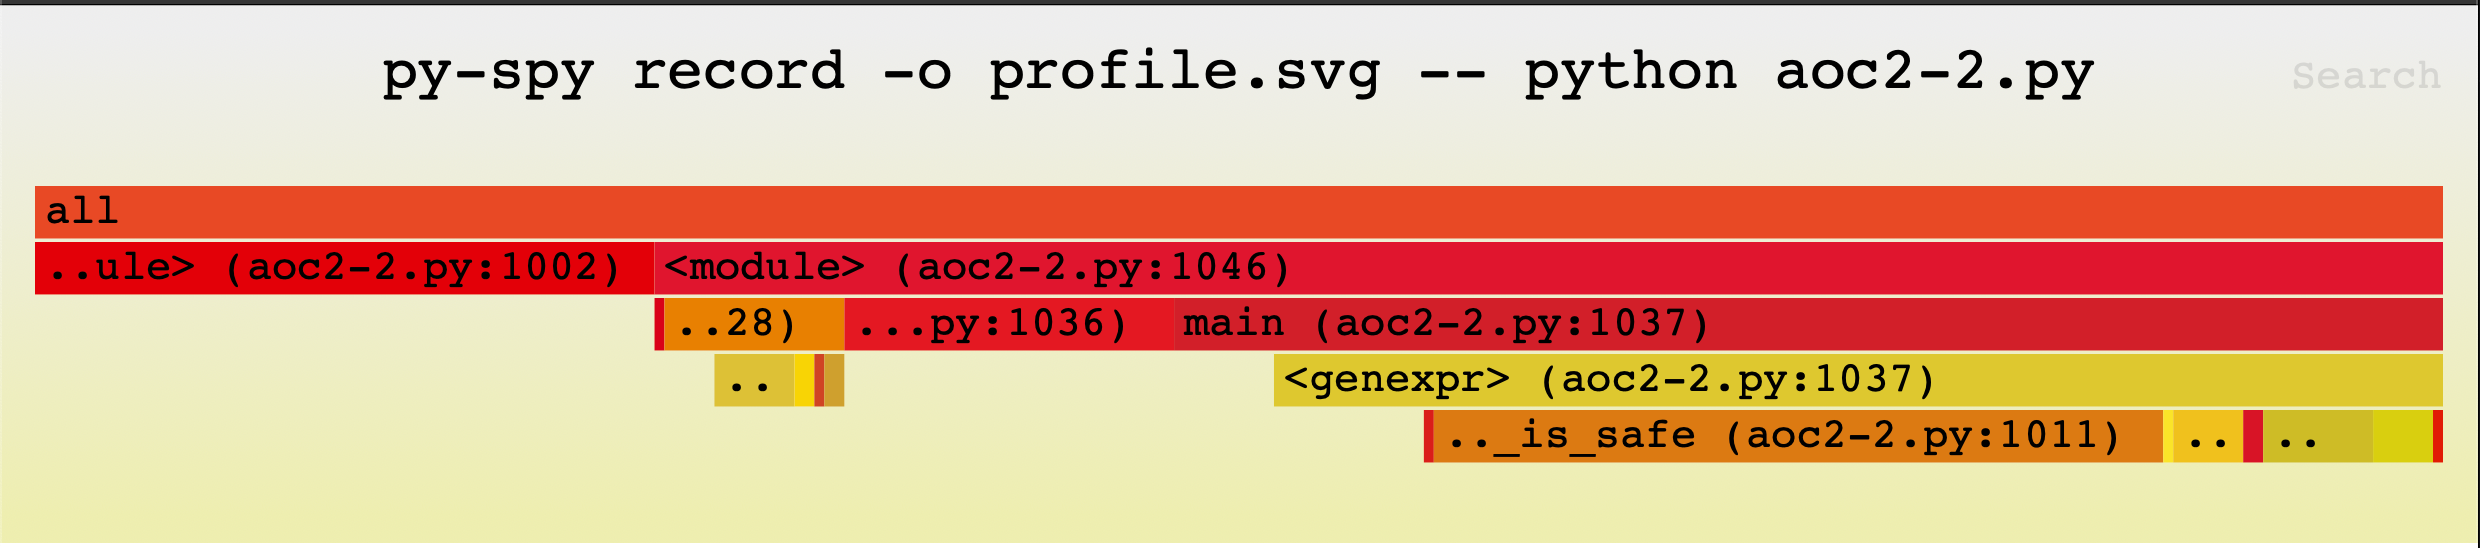
Py-Spy generates a flame graph, which visualizes stack traces over time. In this case, we see a wide block for <module> and main, then narrower blocks representing the generator expression and check_is_safe. This tool is great for profiling production code or long-running scripts without modifying source code or restarting processes. It gives a quick visual cue about where time is spent, though not as detailed as line-level profilers.
I like this tool, but I only use it when I need to debug something that is already running and I cannot restart or reproduce locally. It also could be used to see where a program is stuck. It has very low overhead, and run in a separate process, so it should not impact your production code.
Scalene
scalene aoc2-2.py
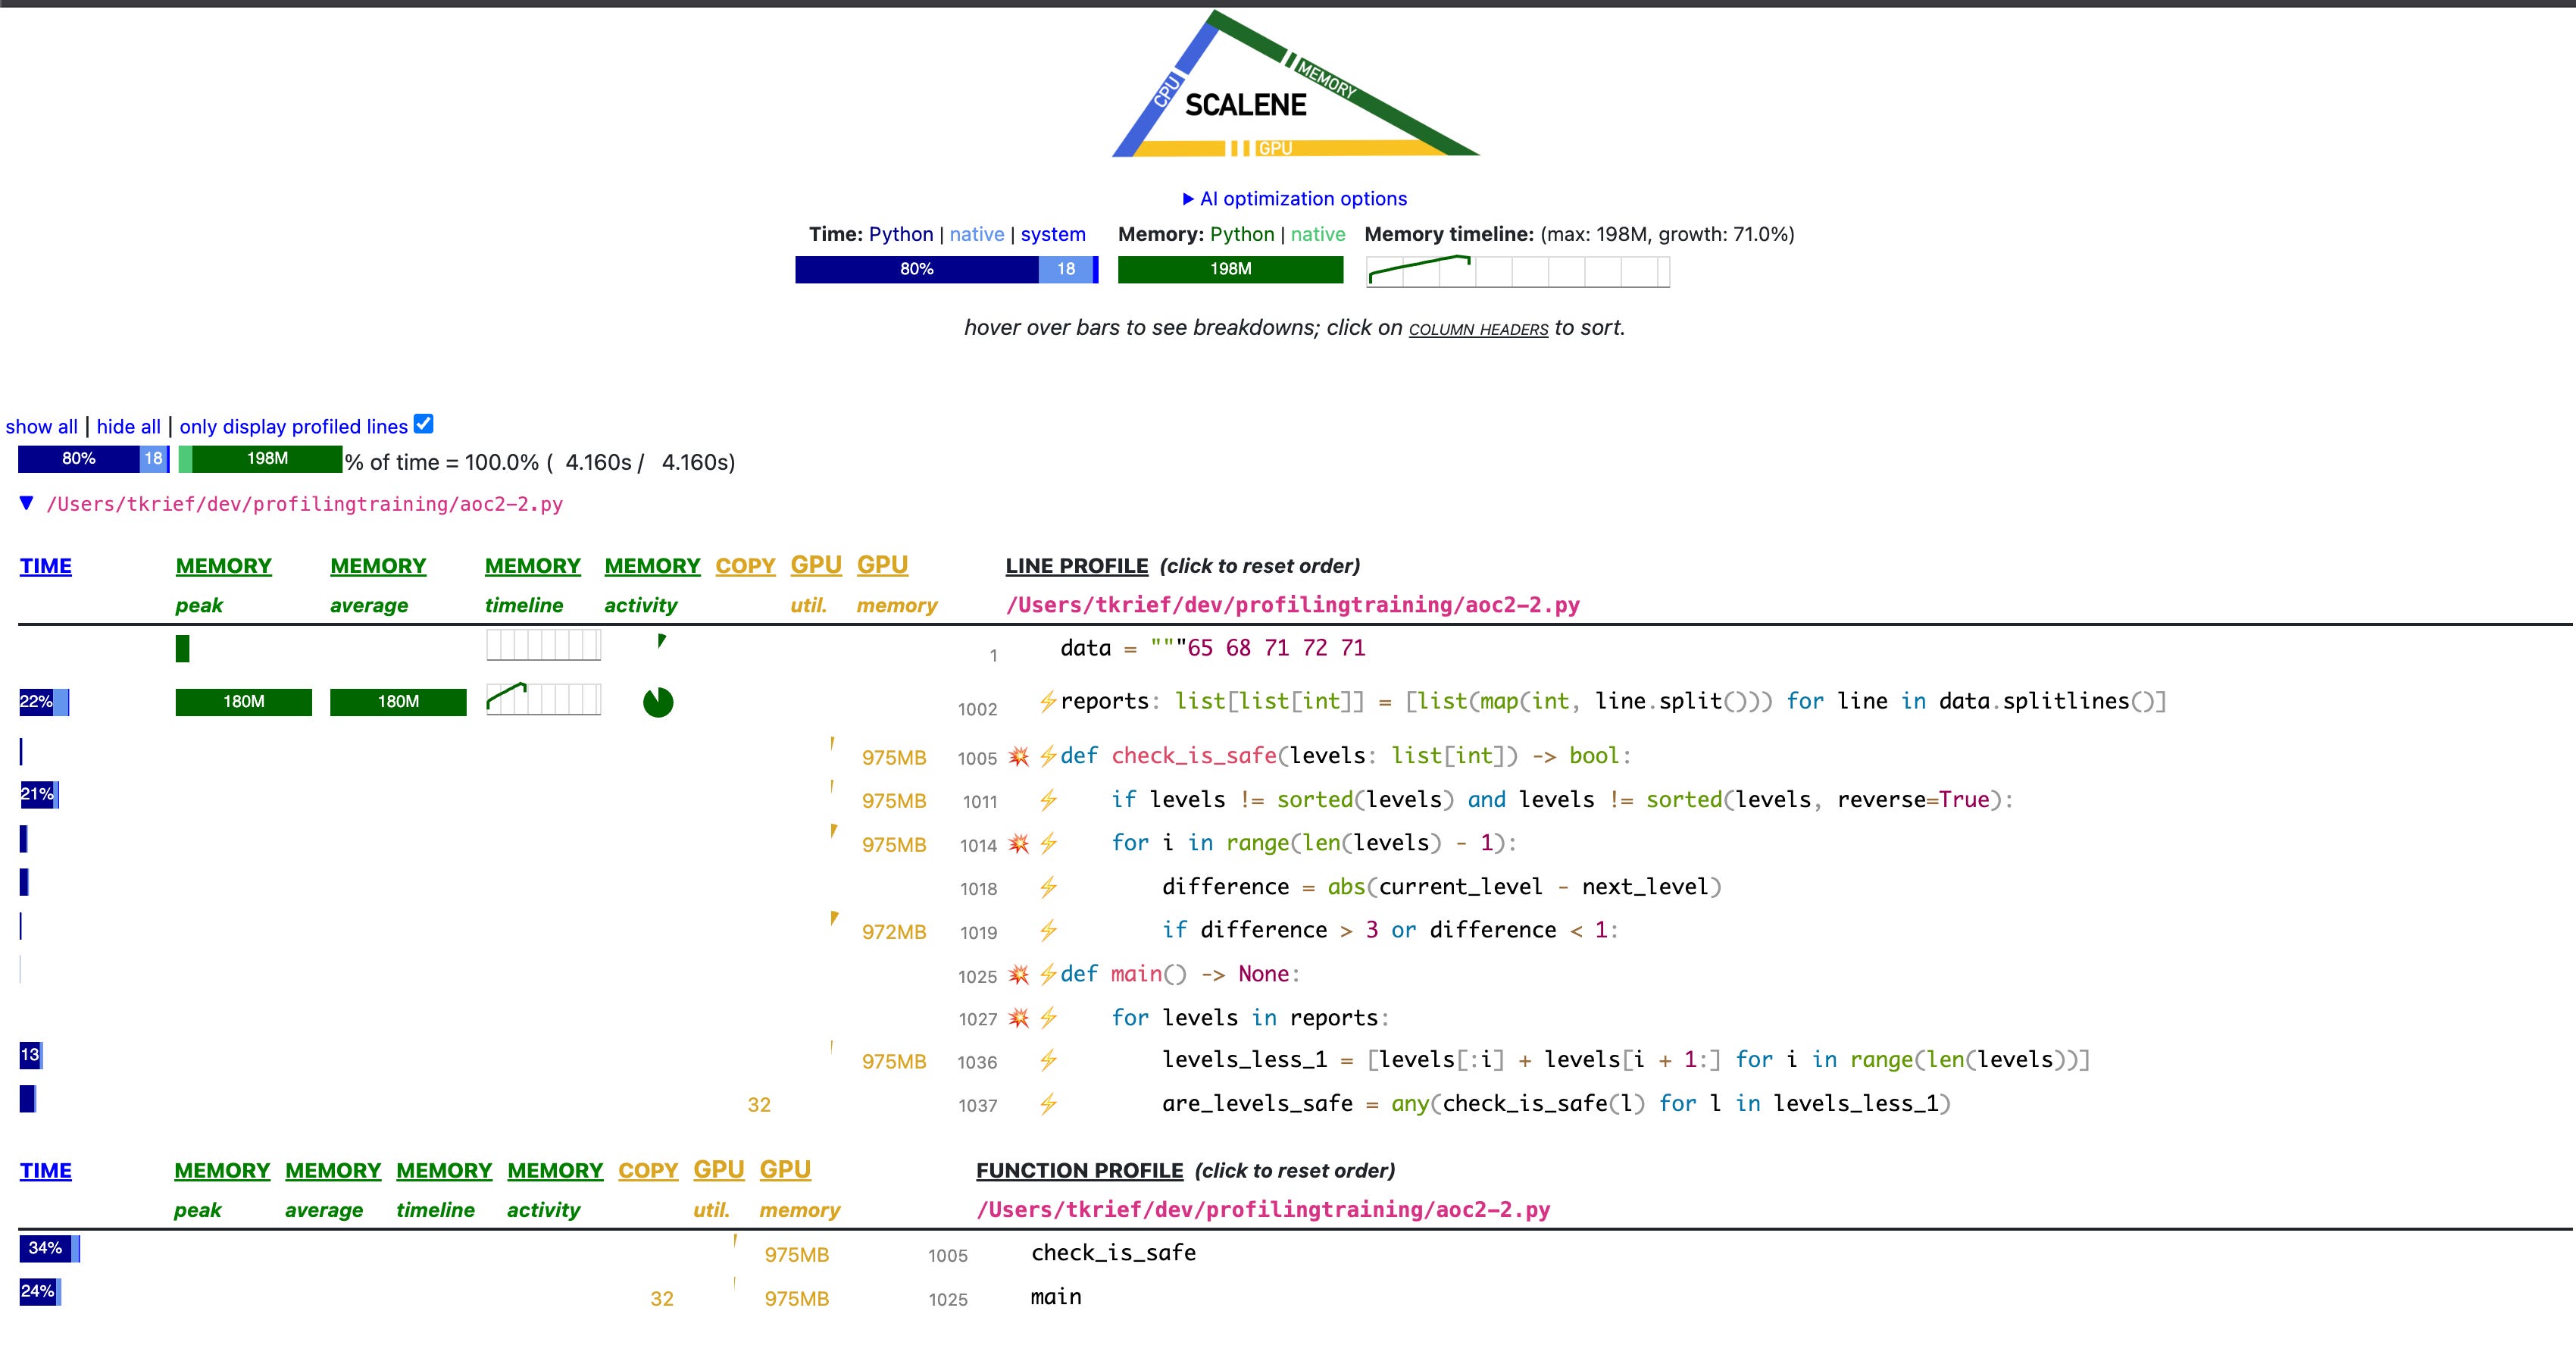
Scalene combines CPU profiling, memory tracking, and even line-level timing into one HTML report. In the screenshot, we see that the check_is_safe function is a hotspot, and memory usage spikes within that block. It even highlights how much time is spent on each line. This tool is ideal when you want to understand not just how long things take, but also how much memory they consume, line by line.
What would TK do ? My workflow.
Start with
timeif your script is easy to run and you just want a quick sense of how long it takes overall.Then use PyInstrument to get a high-level overview of where the bottlenecks are. It’s fast, has low overhead, and gives a clear call-stack timeline. It has amazing integrations with web frameworks and all kind of things you can run into.
If you want to dig deeper and optimize specific functions, reach for cProfile. It’ll give you exact call counts and timings, which is great for tight loops or recursive code. The overhead is higher though.
When you’re dealing with something running in production, or hard to reproduce locally, Py-Spy is your go-to tool. You can attach it to a live process without restarting anything.
And finally, if you want to get performance & memory at the same time, Scalene gives you per-line CPU, wall time, and memory usage in a single report. I discovered this tool recently, I need to dig deeper.
Performance is just one part of the story.
Next up: tackling memory usage, ORM madness, and other sneaky slowdowns. Stay tuned!